Brief Overview of FedRAMP’S History
FedRAMP, which stands for the Federal Risk and Authorization Management Program, is a United States government-wide program that provides a standardized approach to security assessment, authorization, and continuous monitoring for cloud products and services.
Let’s Look Back At Its Evolution
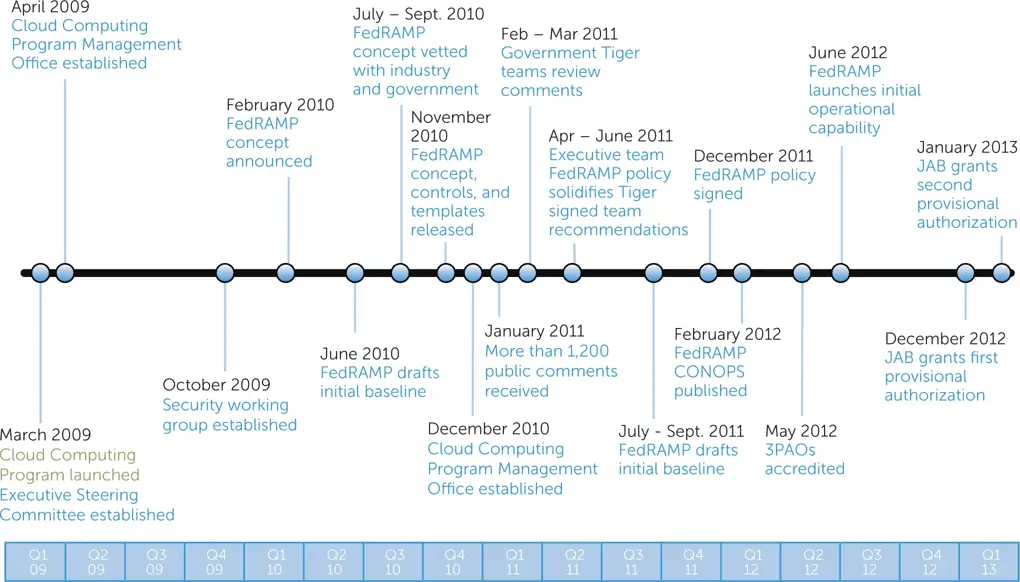
Nowadays, to access to the Federal market, every applications, productions, network systems which are related to Cyber Security, have to be “FedRAMP-compliant”
Introduction of FedRAMP Certified Grafana
To guarantee the uptime and reliability of our FedRAMP cybersecurity platform, we need a dedicated monitoring system that enables proactive maintenance and rapid incident response from our operations team. The key point is that monitoring system MUST be “FedRAMP-compliant”. It means that the monitor system has to
- Be program independently verified
- Be committed to maintaining that high standard of security
Moreover, the FedRAMP Certified Grafana Environment provides an observability platform, which uses the LGTM stack - Grafana (dashboards and visualization), Mimir (metrics), Tempo (traces) and Loki (logs) for FedRAMP customers
Architecture
Global View
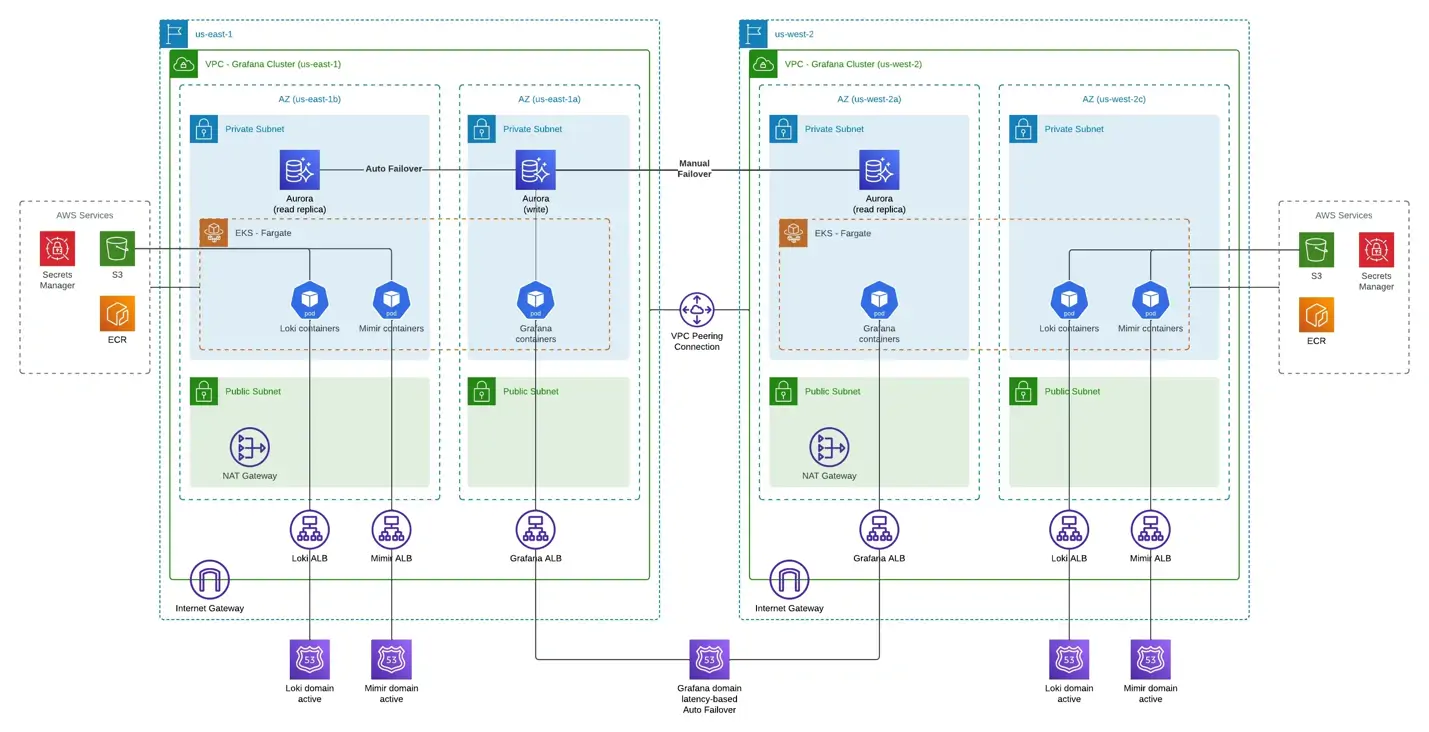
At a high-level, this system consists of two active EKS clusters in two different regions. Metrics and logs from monitoring agents are sent to both clusters at the same time through https endpoints. By having two copies of data in two different regions, we can ensure high availability for Loki and Mimir.
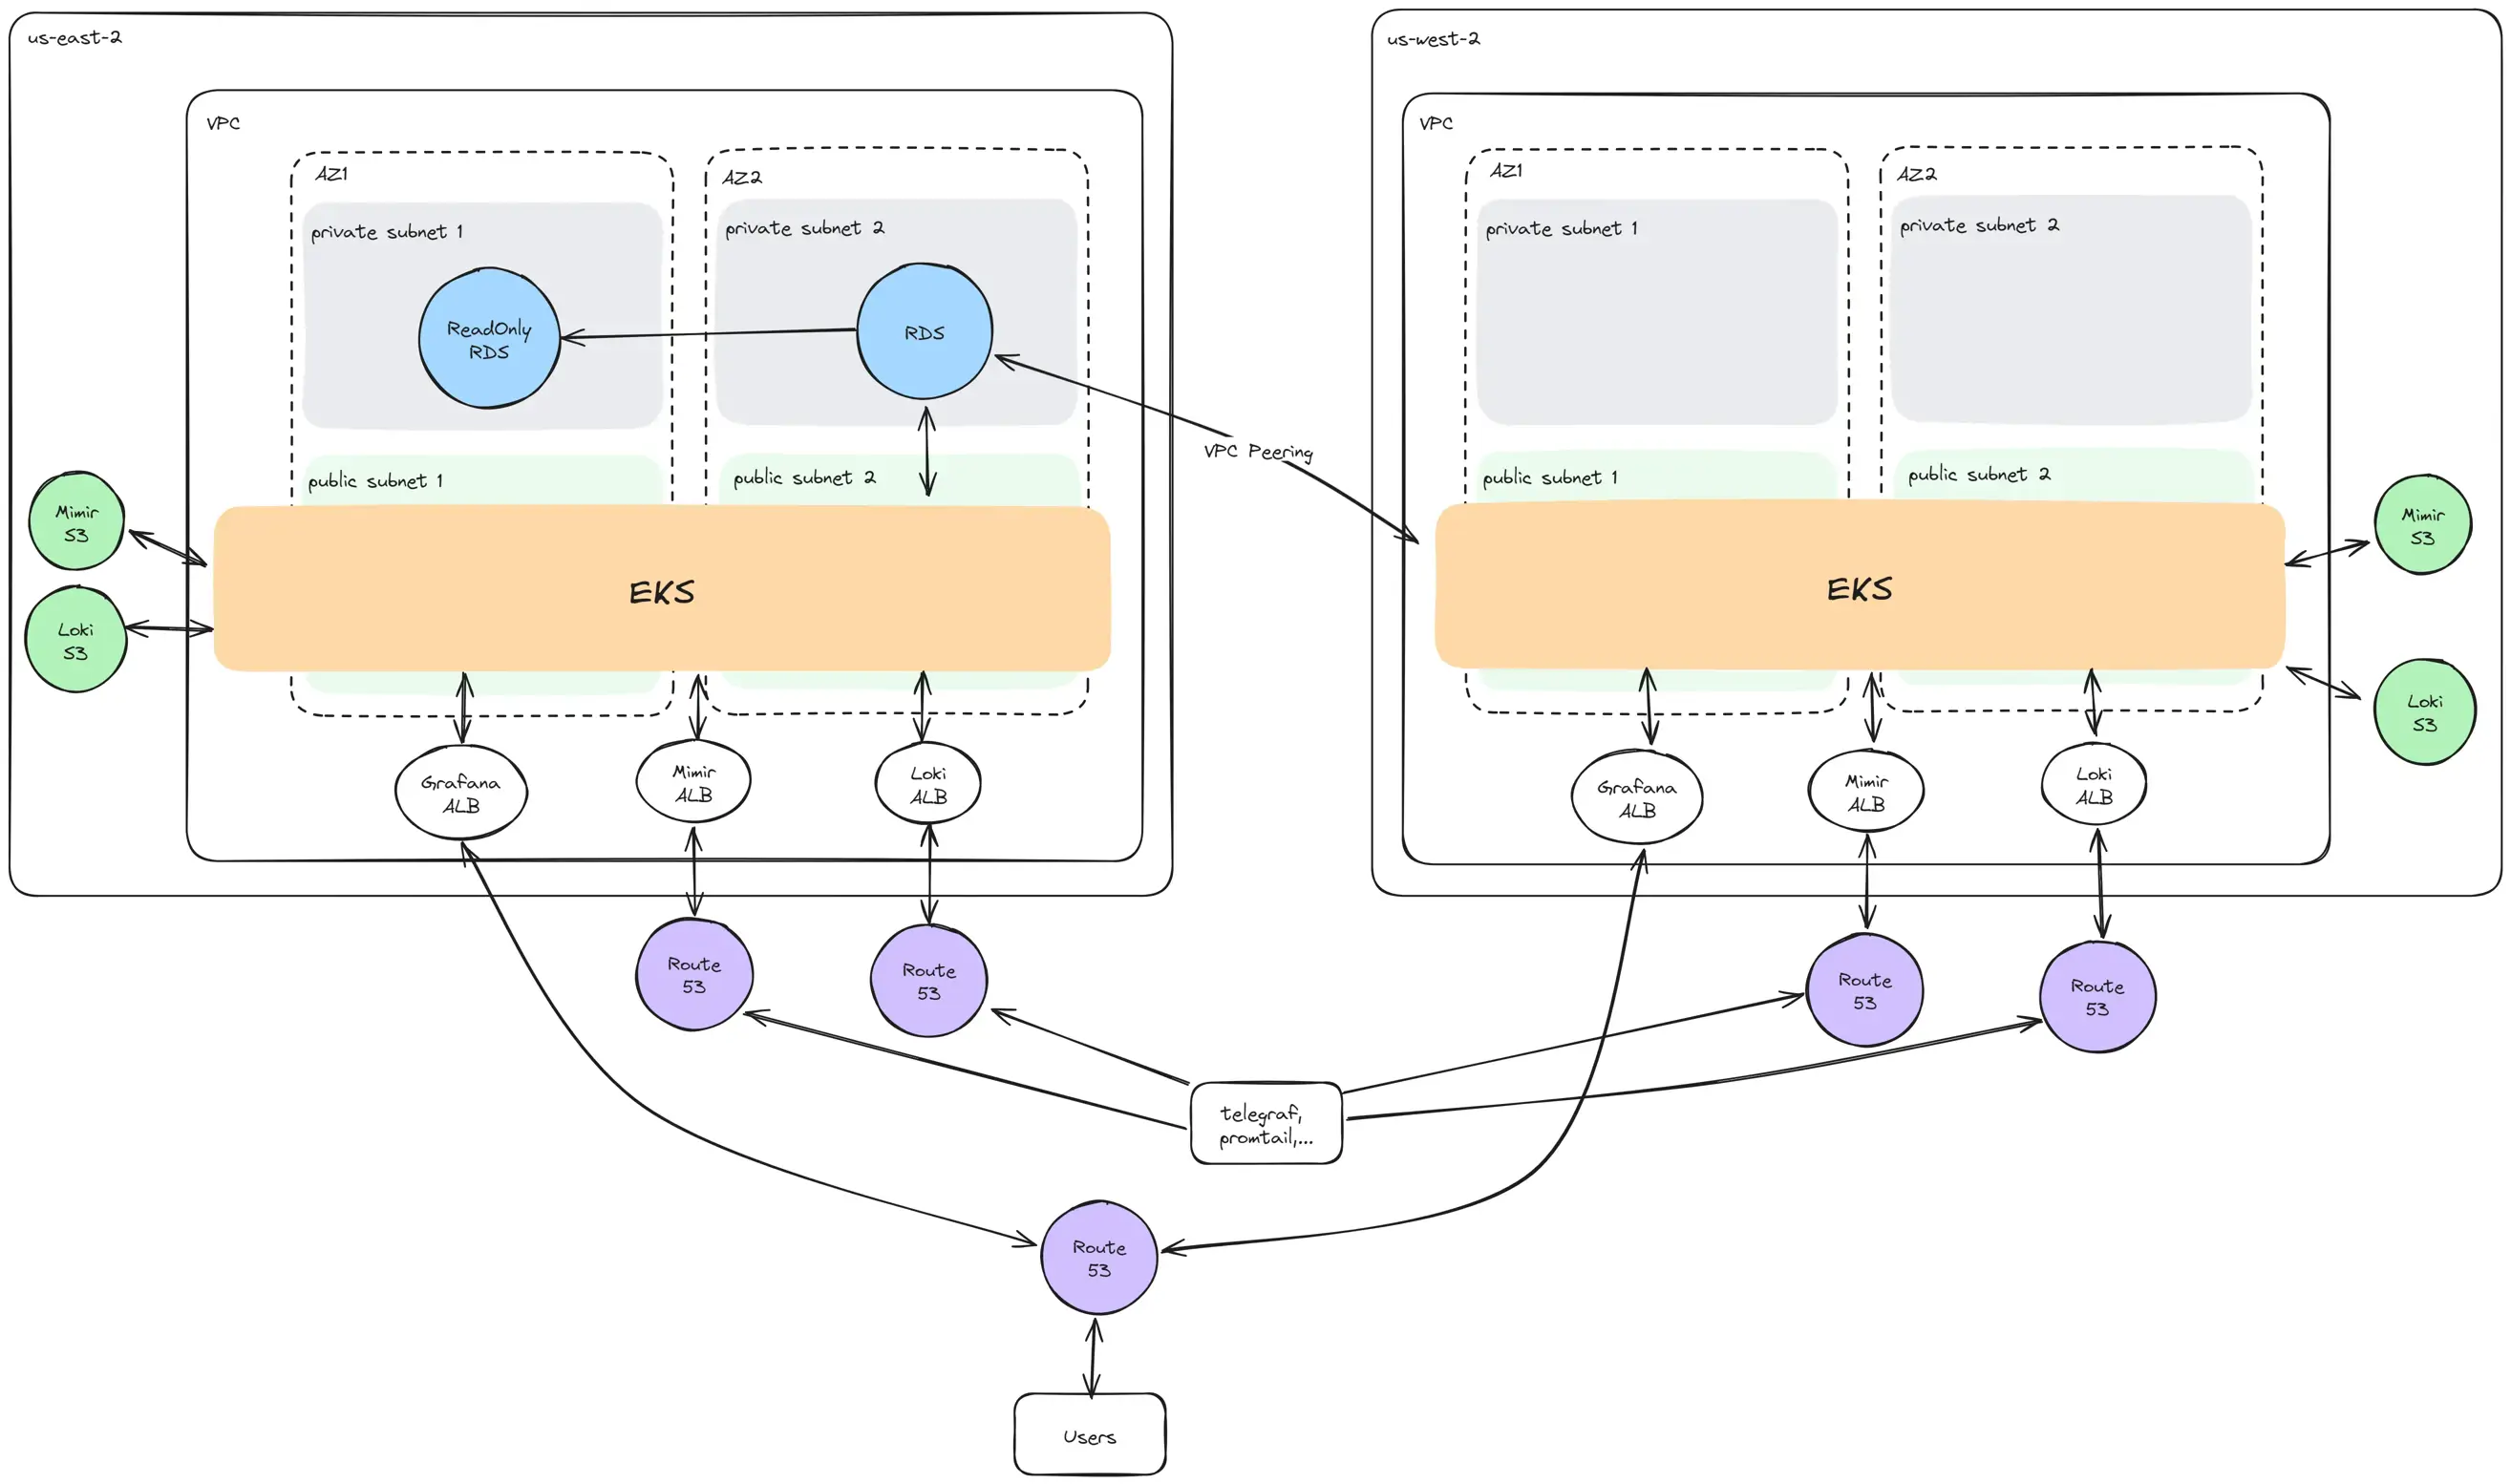
- The RDS cluster resides in the private subnets of the primary region and has one read-write instance in one Availability Zone, one read-only replica in another zone. If the read-write instance fails, the read-only replica within the same AZ will be automatically promoted to receive traffic. The Grafana application in the secondary region communicate with the RDS instance through a VPC Peering connection.
- Route 53 provides five public domains: two for Mimir's ALBs, two for Loki's ALBs and one for Grafana's ALB. The domain for Grafana will route users the region that has the lowest latency. AWS Certificate Manager (ACM) provides SSL/TLS certificates for these five domains.
Regional View
An Amazon EKS cluster (FIPS enabled) consists of two primary components:
- The control plane managed by AWS
- The data plane
Data Plane
For the data plan, this system uses the "managed node groups" node type, which are a blend of automation and customization for managing a collection of Amazon EC2 instances. The diagram below shows the data plane.
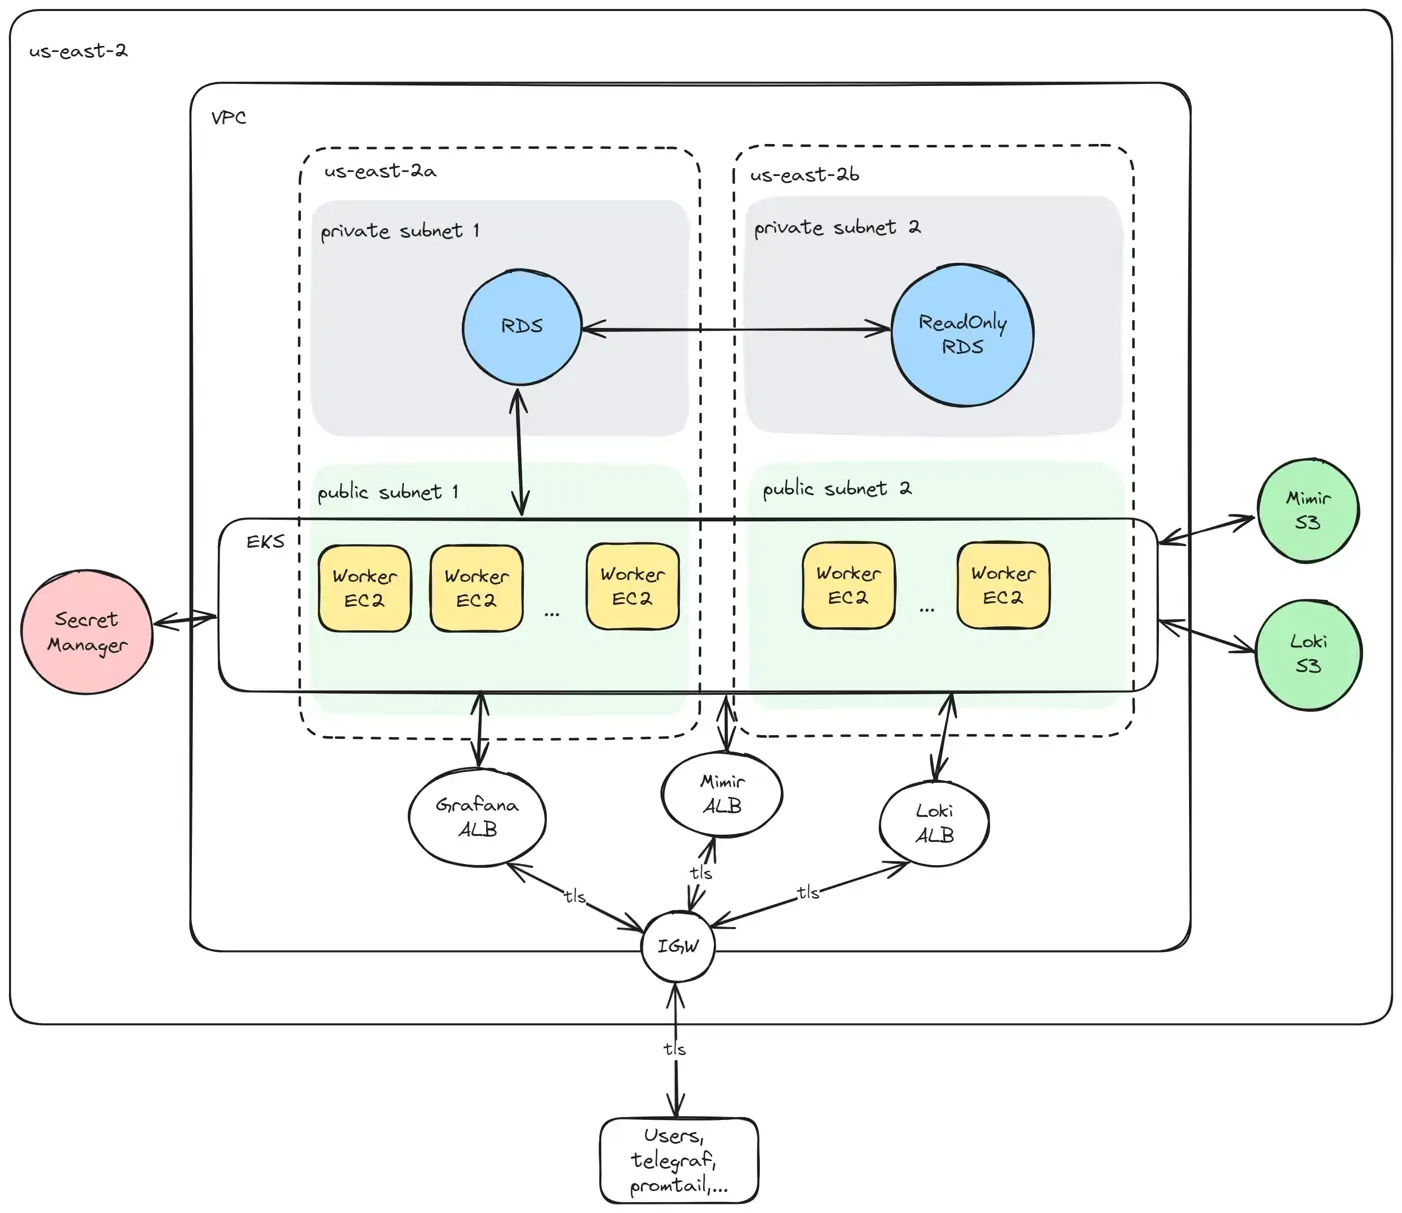
The RDS cluster uses Aurora MySQL engine and password authentication method. During the provisioning of RDS, the default admin user is also created and gets all the privileges listed here. In addition to the admin user, another minimal-privileges user for Grafana is created after the EKS cluster is deployed.
Because the RDS cluster is in the private subnet, running an automatic script that connect directly from outside the VPC and create a user is not possible. The EKS cluster is in the same VPC as RDS, so we can utilize a Kubernetes Job object to run the script.
The master and Grafana's passwords are generated by a Terraform resource and stored in Secrets Manager.
Control Plane
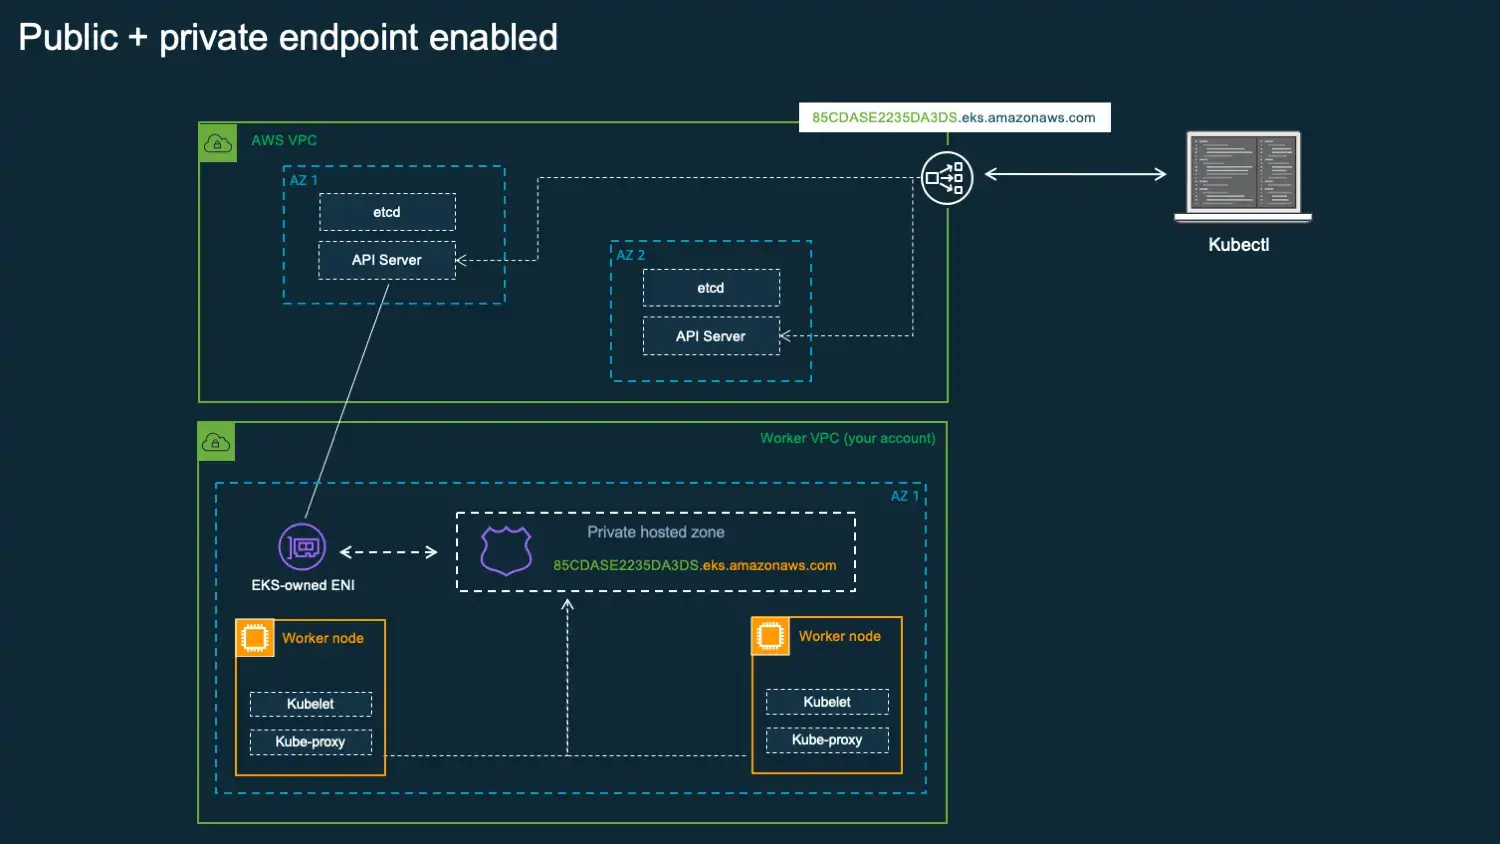
The Amazon EKS control plane consists of control plane nodes that run the Kubernetes software, such as etcd and the Kubernetes API server. The control plane runs in an account managed by AWS, and the Kubernetes API is exposed via the Amazon EKS endpoint associated with the cluster. Each Amazon EKS cluster control plane is single-tenant and unique and runs on its own set of Amazon EC2 instances.
The cluster control plane is provisioned across multiple Availability Zones and fronted by an Elastic Load Balancing Network Load Balancer. Amazon EKS also provisions elastic network interfaces in our own VPC subnets to provide connectivity from the control plane instances to the nodes (for example, to support kubectl exec, logs, proxy data flows).
This system enables both public and private endpoints. This means that Kubernetes API requests from within the VPC communicate to the control plane via the EKS-managed ENIs within the VPC and the cluster API server is accessible from the internet. CIDR restrictions are in place to limit client IP addresses that can connect to the cluster API server endpoint.
AWS encrypts all of the data stored by the etcd nodes and associated Amazon EBS volumes using AWS KMS by default. We also enable envelope encryption for secrets with customer managed KMS keys. At its core, a Zero Trust strategy assumes that no traffic is trustworthy by default, regardless of whether it originates from inside or outside the network. Every request—whether from a user, device, application, or service—must be continuously authenticated, authorized, and validated before gaining access.
Cluster View
Inside each cluster, we installed the lgtm-distributed helm chart including Loki, Grafana and Mimir via Terraform. The diagram below shows the main components of this chart (Mimir doc, Loki doc).
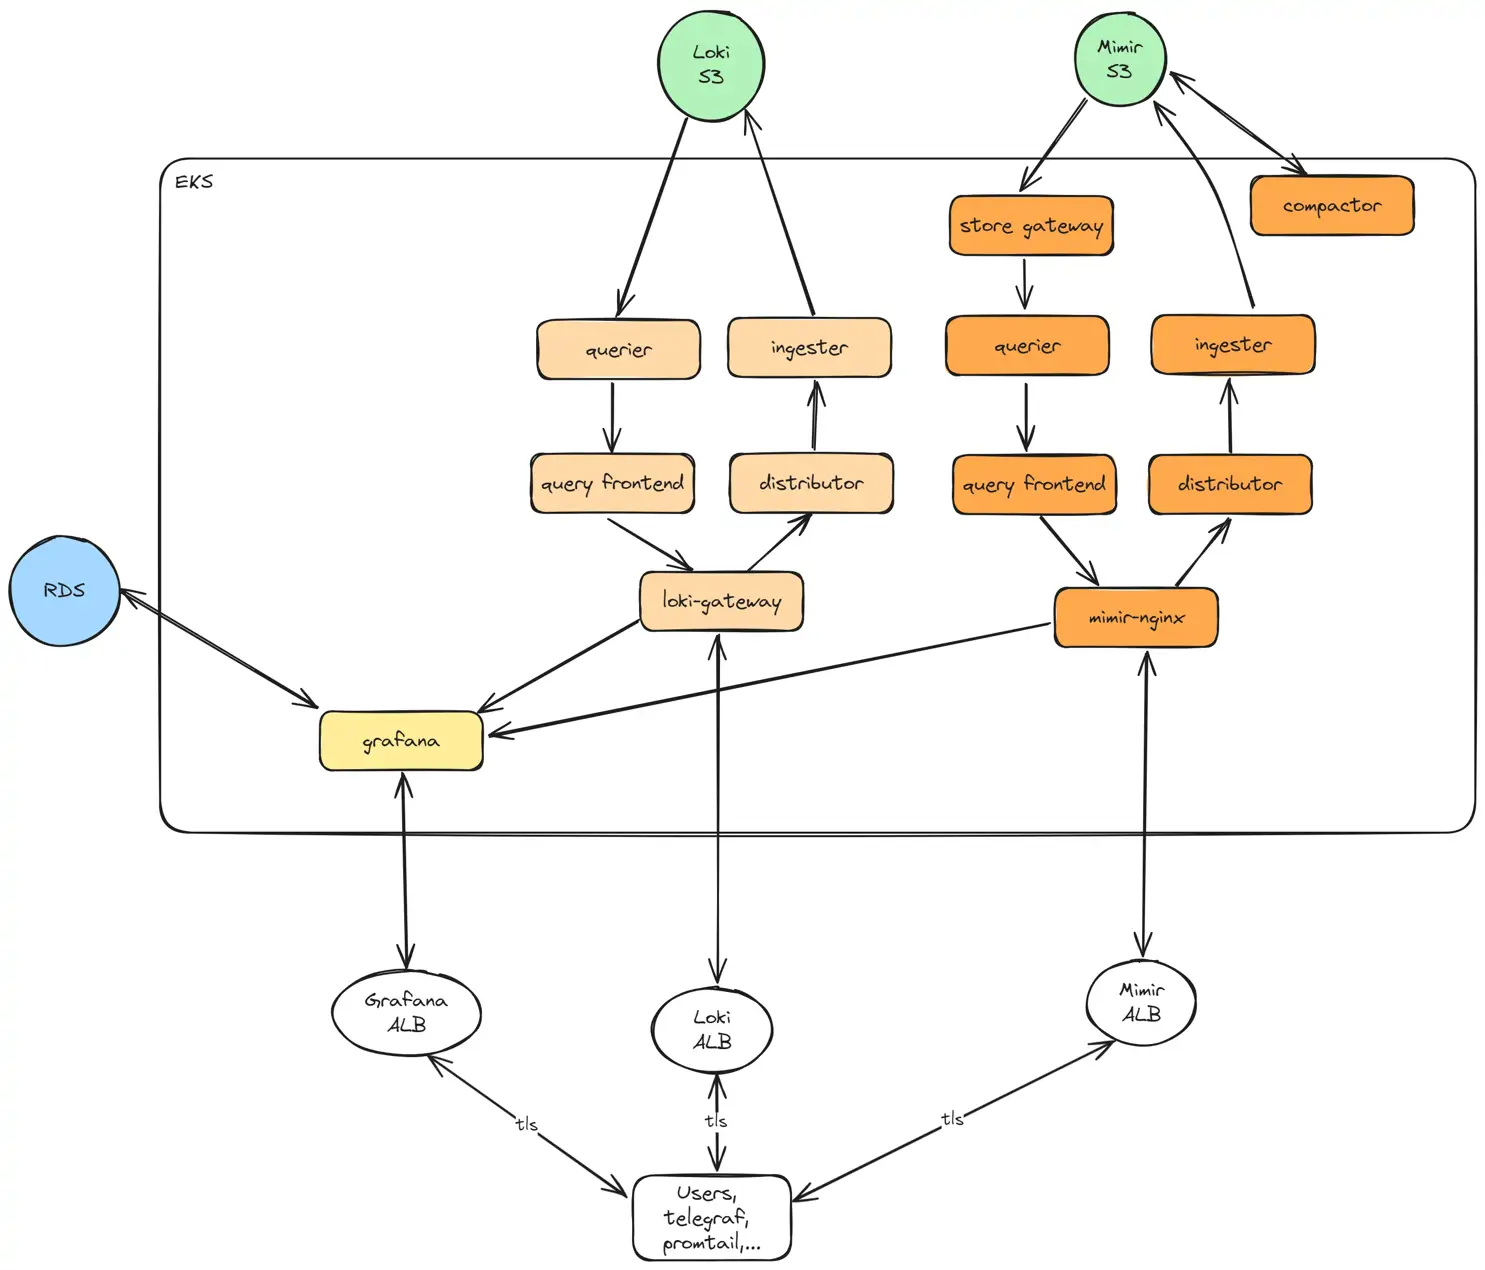
This chart comes with default configuration values, which are overridden by a combination of --set flags and a yaml file as part of helm install's command arguments. The helm install command is defined as resource "helm_release" in Terraform. Sensitive data such as RDS passwords is passed into Kubernetes via helm configuration values that are stored as K8s Secret objects in etcd data store.
The lgtm-distributed chart also creates Ingress objects for Grafana, Loki and Mimir. These objects then create the corresponding Application Load Balancers with the help of AWS Load Balancer Controller. The EKS cluster by default does not have this controller and therefore it is installed via the "aws-load-balancer-controller" helm chart. Traffic between users and the load balancers is secured via HTTPS. Each region has one SSL/TLS certificate associated with all three ALBs and each certificate contains the domain names of Grafana, Loki, and Mimir.
Challenges
FedRAMP Certified Grafana: Gold Standard in Security
Deployment:
- Hardening the Infrastructure: Grafana's host infrastructure must be hardened to meet strict government security standards, such as CIS Benchmarks or DISA STIGs.
- FIPS 140-2/3 Compliance (3): FedRAMP mandates that the entire Grafana stack use only FIPS-validated cryptography, a complex task often requiring significant software and library modifications to protect data in transit and at rest.
- High-Availability and Disaster Recovery: FedRAMP standards require Grafana to have a complex, highly available, multi-AZ architecture, plus a tested disaster recovery plan to meet specific agency RPO and RTO targets.
Case Study
Compliant Monitoring System - Passed the Schellman’s validation
TMA Solutions, with extensive experience in delivering cybersecurity services to global clients, provided a Compliant Monitoring System for a U.S.-based client seeking to safeguard sensitive data across critical business applications. Drawing on the expertise of its professional and experienced engineering team, TMA implemented a Grafana FedRAMP Monitoring System that is to monitor and respond quickly to incidents to ensure product continuity, is passed the validation of Schellman (which is an independent, private-sector cybersecurity and compliance services firm that works with the government as a third-party assessor)